Testing lens resolution with line pairs
- Daniel Knop
- 22. Okt. 2024
- 10 Min. Lesezeit
Aktualisiert: 24. Jan. 2025
Resolution tests with line pairs per millimeter are ideal for testing the detail capture of lenses. But there is a lot to consider.

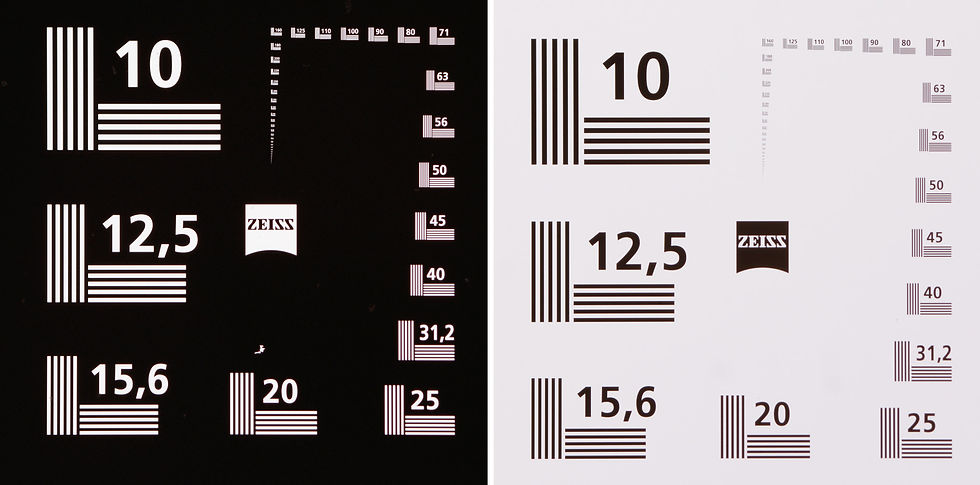
To measure the resolution of lenses - i.e. their ability to reproduce the finest details - black lines on a white background are generally used, occasionally also white lines on a black background. These lines and the distances between them become narrower and narrower, and the unit of measurement is pairs of lines (one black and one white line) that are just perceptible as separate at a line width of one millimeter (lp/mm).
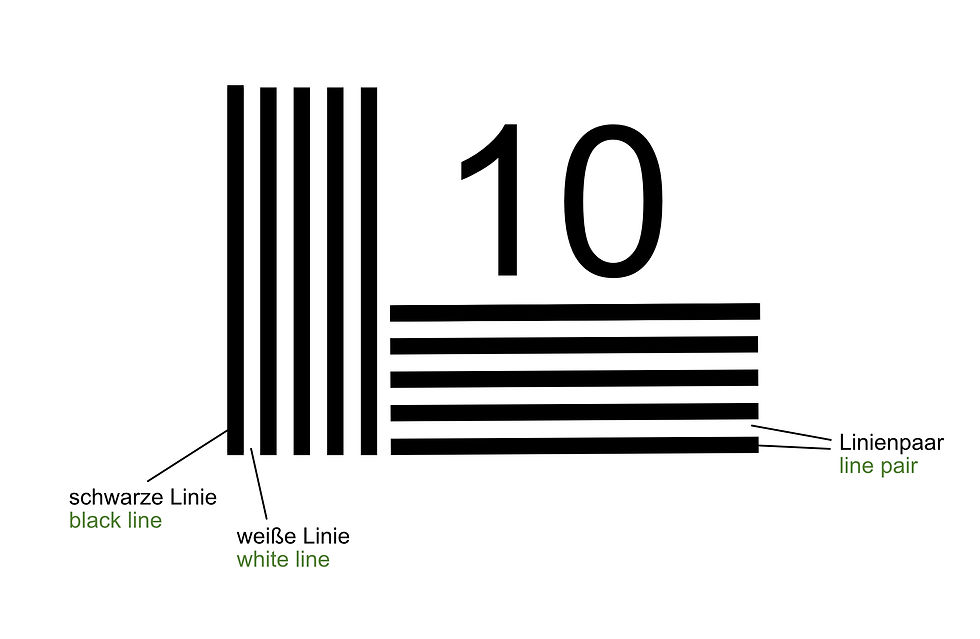
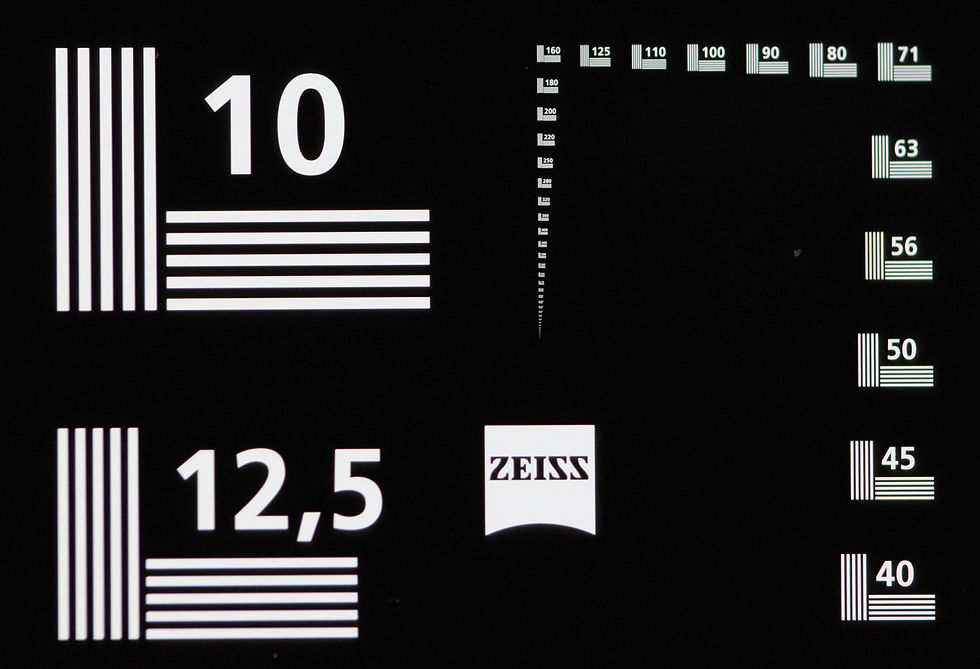
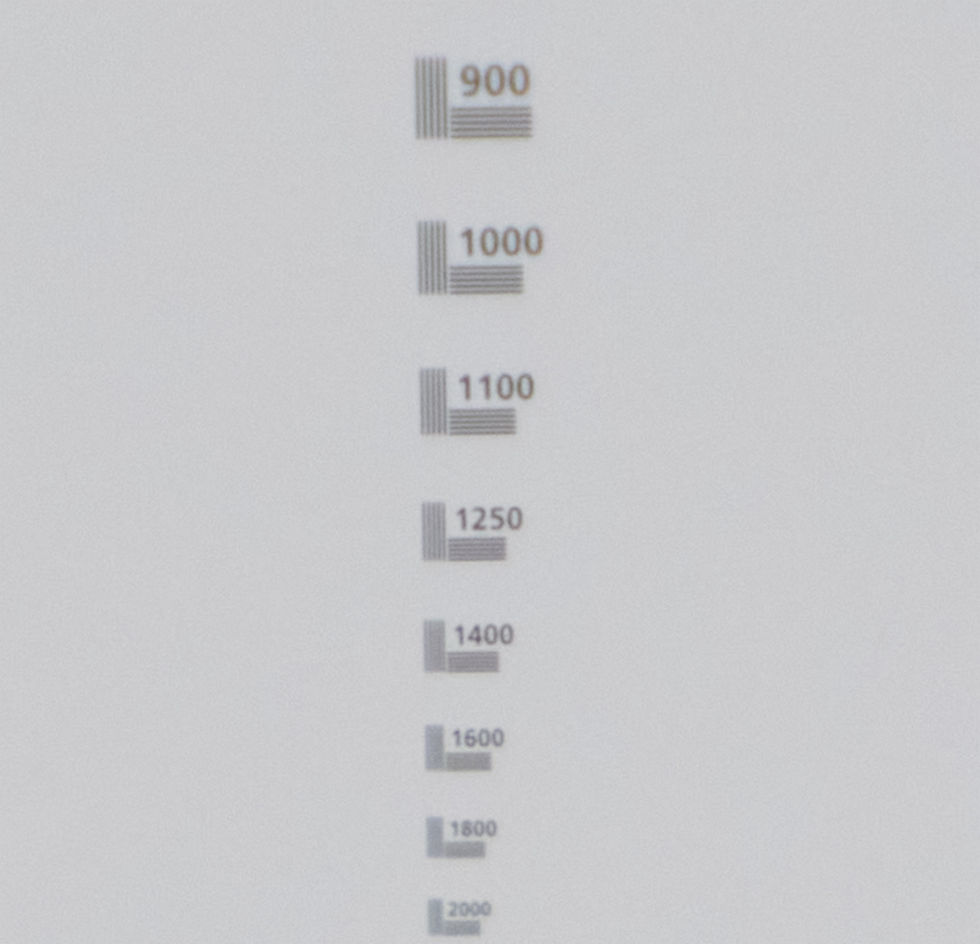
On such a measuring scale, you can see numerous line groups of different widths, and next to them the number of line pairs that would fit on one millimeter at this width. Simple tests, which usually go up to around 250 lp/mm, are only suitable for normal camera lenses, not for microscope lenses, as their resolution is much higher. They are often offered, even for moderate prices. Anything but cheap, however, is the “Resolution Test 3000” from Zeiss, which displays up to 3000 line pairs per millimeter (lp/mm).
3000 line pairs per millimeter (lp/mm) means 1/3000 mm = 0.000333 mm = 0.333 µm per line pair. This is a resolution that is rather theoretical for microscope objectives. It could only be achieved with very high magnification objectives, e.g. 150x and NA 0.95, but the glass plate is 3 mm thick, so that a high condenser aperture is not possible. A larger numerical aperture (e.g. NA 1.3) is also out of question because it would require working with immersion oil, which could jeopardize the sensitive coating of the test glass. A similar one, which costs a little less and reaches up to 3300 lp/mm, is available from the company “Technologie Manufaktur”(www.technologie-manufaktur.de), and is also available with cover glass embedding.

It sounds fantastic: all you have to do is take a photo of this test field and you can simply read off the resolution achieved - at least in theory. In practice, however, things are much more complex. First of all, what we are testing is not really just the maximum resolution that the lens can achieve. What we are testing is the resolution that we achieve with the given combination of lens and camera. We are not testing the lens, but a photo that the camera and lens have taken, and the camera also limits the quality in many ways. The camera's sensor is the most important factor here. The sensor format is a minor matter, but the size of the pixels is important.
Reading the values is very subjective and also depends on visual performance. In borderline cases, the brain of the person taking the reading can also interpolate the separation between the lines and thus suggest their existence, even though the neighboring lines are actually blurred.
In order to assess the actual sharpness performance of a lens, measurements must be taken in the center and at the edge of the image field, because only both measurements together give an impression of the sharpness performance. If there is a curvature of field, this is normally a problem because the focus is not sharp in the center and at the edge at the same time. In focus stacking, however, this is not a problem because this curvature is neutralized via a series of images with a shifted focal plane, which is also used in focus stacking photography.
However, the measurement in the center alone only provides a rough guide for assessment. Some microscope objectives are optimized for high image sharpness in the image center to such an extent that the edge of the image circle loses a great deal of sharpness. In conventional microscopy, this is often negligible because in many cases only the image center is observed. However, if we use such a lens for photography, possibly even with a full-frame sensor, this results in a high image sharpness in the center and an enormous loss of sharpness at the edges. However, this is not a bad lens, but simply an unsuitable combination of lens and sensor size.
More pixels than lines
To display a pair of lines on the sensor, an absolute minimum of two pixels is required. Actually more, because with two pixels it would only work if lines and pixels were absolutely congruent, which is unrealistic. So this is more of a theoretical value - but let's take it as a given for the sake of simplicity in order to make the physical relationships understandable.
On a full-frame sensor, we image 36 millimeters image width. At 100 lp/mm, which should be displayed 1:1, this would theoretically be 3,600 pairs of vertical lines across the entire sensor width. Theoretically, we would therefore need an absolute minimum of 7,200 pixels (3,600 x 2). A Canon R5II full-frame camera has 45 megapixels, in detail 8192 x 5464 pixels. According to this (unrealistically simplified!) calculation, with a good 8000 pixels in the image width over 36 millimeters, we would have just enough pixels to display the 3600 line pairs. But even at 120 lp/mm the sensor would be overtaxed, because the 4320 line pairs would require 8640 pixels according to our assumption.
Also, the size of the pixels is also eminently important in this case, because if we are dealing with a full-frame sensor with 20 megapixels, for example, the chances of reproducing an extremely thin line sharply are incomparably worse than with 50 megapixels: As soon as a single pixel is wider than a line, the resolution of the lens is superior to that of the sensor.
Let's make an example calculation:
Canon R5II, full-frame sensor, 45 MPix, pixel size 4.4 µm
8192 px : 36 mm = 227, i.e. 227 pixels per millimeter of image width
100 vertical line pairs per millimeter of image width should be displayed:
227 pixels : 100 line pairs = 2.27 pixels per line pair
Theoretically, these 100 line pairs could just about be displayed, as an absolute minimum of two pixels would be required per LP. In practice, however, these line pairs would only be visible with precise contours if the lines were exactly congruent with the pixel rows, which is unrealistic.
Suitable cameras
The following cameras, for example, would be better suited:
Nikon D7200 or D7100 (APS C, 24 MPix, pixel size approx. 3.9 µm)
Canon EOS 90D (APS C, 32.5 MPix, pixel size approx. 3.2 µm)
Sony Alpha 6400/6600 (APS C, 24 MPix, pixel size approx. 3.9 µm)
Nikon D7200 or D7100Olympus OM-D E-M1 Mark II (MFT, 20 MPix, pixel size approx. 3.3 µm), and the best cameras for such measurements are special cameras for astrophotography or microscope photography with even smaller pixels, because their size reaches values far below 2 µm.
In fact, we need considerably more than two pixels to display two lines cleanly as separate. Here it becomes clear that the camera used and its pixel size and number have a considerable influence on the precision of the line display and thus the measurement. At the same time, it becomes clear that the optical magnification power of the lens plays into our hands here, as we have to scale up less to read the result. For this reason, the result of such a resolution test should only ever be understood as an approximate guide value, especially with low magnification optics.
The decisive factor when reading is that the space between two black lines is actually bright, with a continuous separation of the black lines. The color of this space must also be clearly distinguishable from the black of the lines. In the borderline case, it is perceived as gray, and this is precisely where the individual judgment of the viewer begins - one person still interprets a certain block of lines as separate lines, while another may not.
Pixelated line pairs
It is therefore particularly difficult to read with low magnification lenses with high detail capture (macro lenses), because they access areas whose line pair groups are very small, so that they have to be greatly enlarged for reading. Imagine a lens that produces a 1:1 image, i.e. does not magnify, and next to it a lens with a magnification of 10:1, i.e. magnifies ten times. Both now focus on the group of lines that they can just display separately. The 10:1 lens magnifies them tenfold, making them easier to read. The 1:1 lens, on the other hand, does not magnify them at all, so they have to be scaled up in the photo, and this may show that the sensor resolution is no longer sufficient to provide the minimum number of pixels required for each pair of lines. The line pairs of the 10:1 lens, on the other hand, were each represented by far more pixels and are depicted more precisely.
Scales from 1:1 to about 2:1 are the most difficult, because if the relevant reading zone in the photo is scaled up sufficiently, the line pairs will be clearly pixelated even with a high-resolution camera (here Canon R5II with 45 megapixels), which makes the reading process dramatically more difficult, sometimes even impossible. With these image scales, the readings should therefore be treated with particular caution; the actual resolution of the lens in question may be significantly higher, as the finer line pairs may be pixelated.
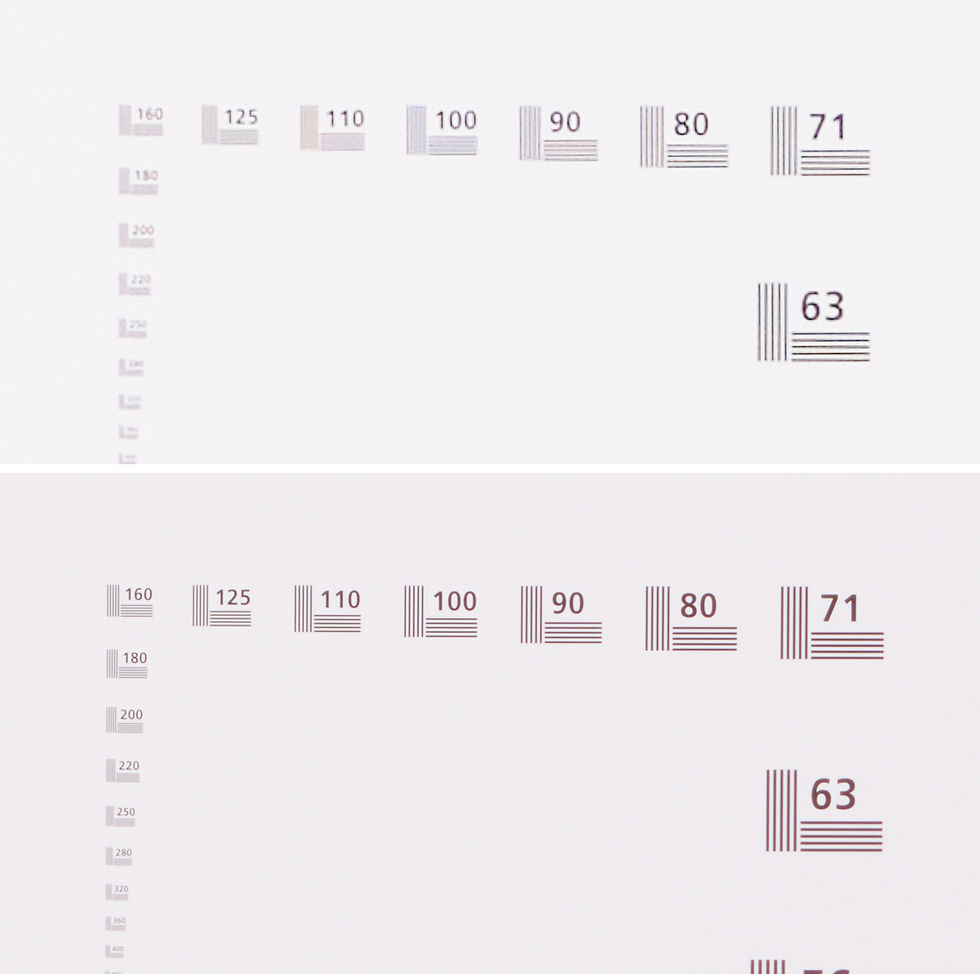
The less the groups of line pairs in the test photo have to be scaled up for reading, the more pixels are used for a single line and, to the same extent, these lines are displayed more precisely and are therefore easier to recognize. With microscope objectives with magnification scales of 10x to 50x, it is far less difficult to read the result precisely, because the greater the loss-free optical magnification of the objective, the thinner the line pairs that can be reproduced. In fact, we can only ever compare lenses with the same magnification.
Lighting and focusing
There are also other factors, e.g. sub-optimal lighting, bad focusing and the fact that the reading process itself is a matter of judgment in borderline cases, as two people may judge a certain representation of the finest lines differently.
Other things must also be taken into account, such as the wavelength of the light used, as this influences the resolution of the lens. The human eye perceives green-yellow radiation as the brightest, which is why lenses are normally corrected for this wavelength and therefore perform best here - apart from special optics for other wavelengths. However, if the illumination of our resolution test deviates significantly from this wavelength, the sharpness performance of the lenses may also be altered. Short-wave light (blue radiation) enables a higher resolution performance than longer wavelengths. In the tests for this website, however, a daylight color of 5600 Kelvin was used because it can be assumed that similar light will also be used in focus stacking photography with flash or LEDs.
Diffuse backlighting is recommended for resolution tests with glass plates. However, do not point a lamp directly into the lens, but rather the large-area reflection of the light, e.g. over a sheet of white paper at a 45-degree angle to the sensor plane.
The camera resolution
I always work with a high-resolution camera (Canon R5II with 45 MPix) for the resolution tests that I carry out for this website. In order to ensure the best possible focusing, I always take a series of focus shots, from which I then select the single image in which the smallest groups of line pairs that can still be perceived as separate were in the sharpest focus.
As mentioned, these results should generally only be seen as a rough guide, but if they were all taken with the same camera under identical shooting conditions, they at least provide a benchmark for the relative assessment of the resolution - apart from the aforementioned limitation at 1:1 and 2:1. Even if the absolute measured values in the form of recognizable line pairs per millimeter do not stand up to a check with precise laboratory measurement, they still allow a comparison between different lenses of the same magnification.
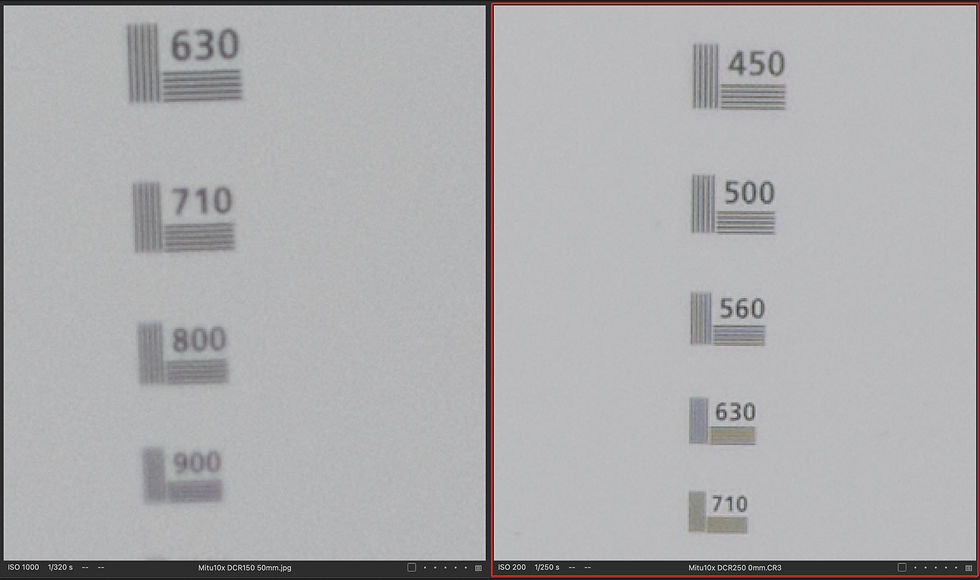
Such measurements also provide insight into the optical behavior of a particular lens at different image scales. For example, it is possible to determine how much the resolution of a Mitutoyo M Plan Apo 10x decreases if it is not used with the tube lens focal length of 200 mm, which is required to achieve the nominal magnification of 10x, but instead a smaller focal length is used (e.g. Raynox DCR 250 instead of DCR150). This means that the lens leaves its optimum working range and delivers a lower magnification, and you can determine how the resolution then compares to other lenses that were designed for precisely this magnification.
Or you can test the resolution performance of a film scanner lens at different image scales that it delivers with different camera focus ratios (distance between sensor and lens), e.g. 1:1, 1.5:1 or 2:1.
Line pairs per image height
But be careful: Do not confuse these measured values with the data that is usually given in tests of normal camera lenses, because the absolute numerical values are considerably higher and are usually between 1500 and 2500 line pairs. This is due to the fact that the line pairs per image height are usually specified. A full format sensor produces an image size of 24 x 36 mm. The value read for the line pairs per millimeter that can still be displayed is therefore multiplied by 24. 2500 line pairs per image height therefore corresponds to 104 line pairs per millimeter.


Kommentare